Dashboard & Reports in Project Management
Advantage is loaded with powerful built-in dashboards and reports, and you can create your own with our self-service dashboard and report writer. Here are just a few examples of popular project management tools built into the system.
Project Statistics Dashboard
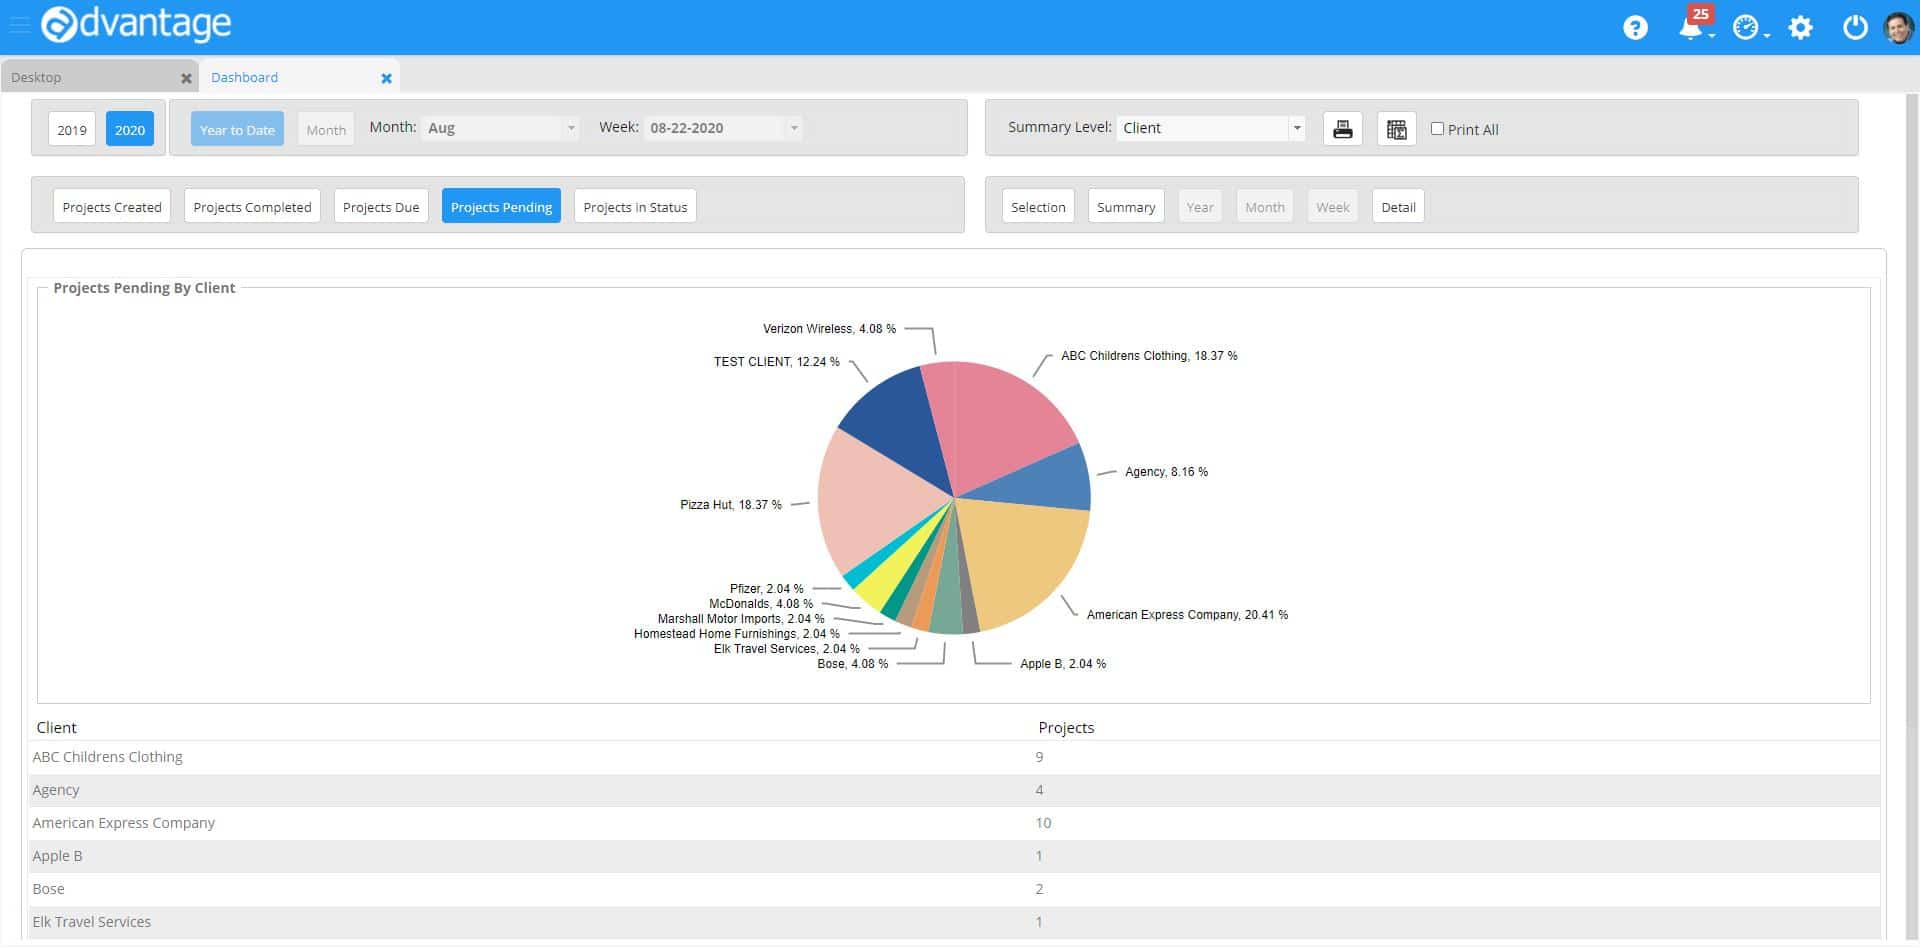
Advantage Software offers this powerful visual tool to slice and dice your project data any way you want. How many projects are active by client or by type of work? How many are due and how many have been completed? Which clients are giving us the most projects? Easily answer these questions and more.
Financial Status Dashboard
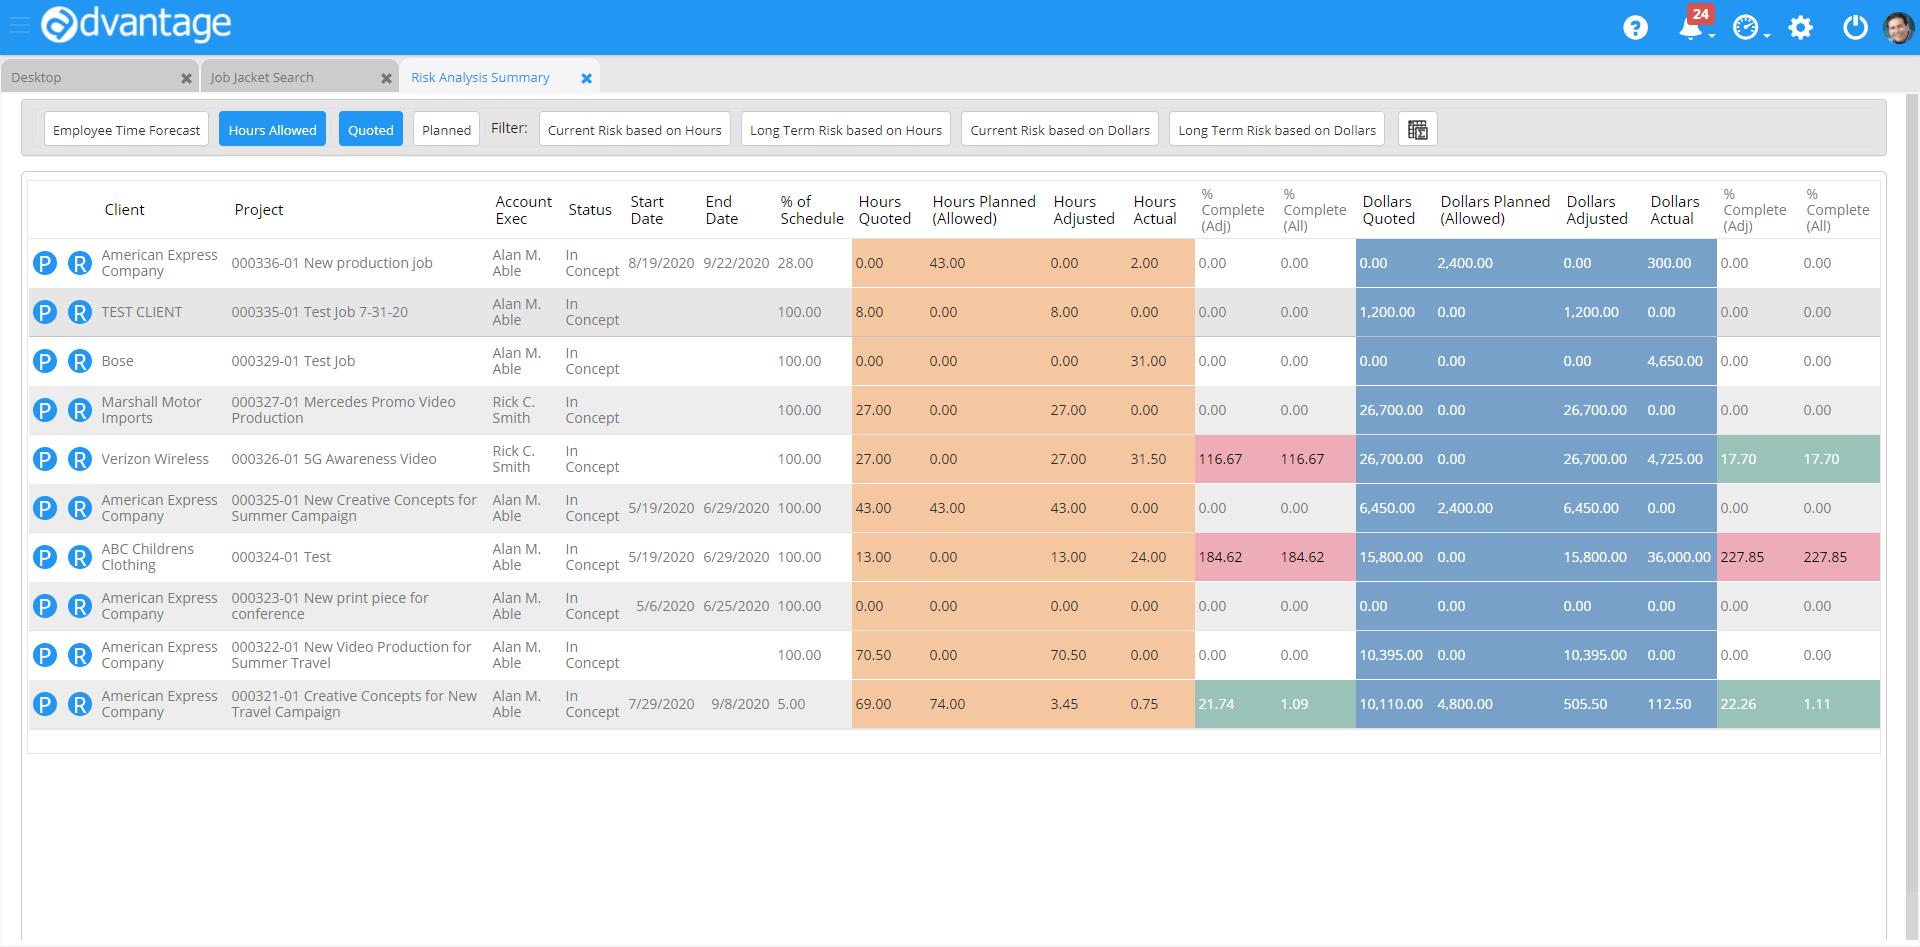
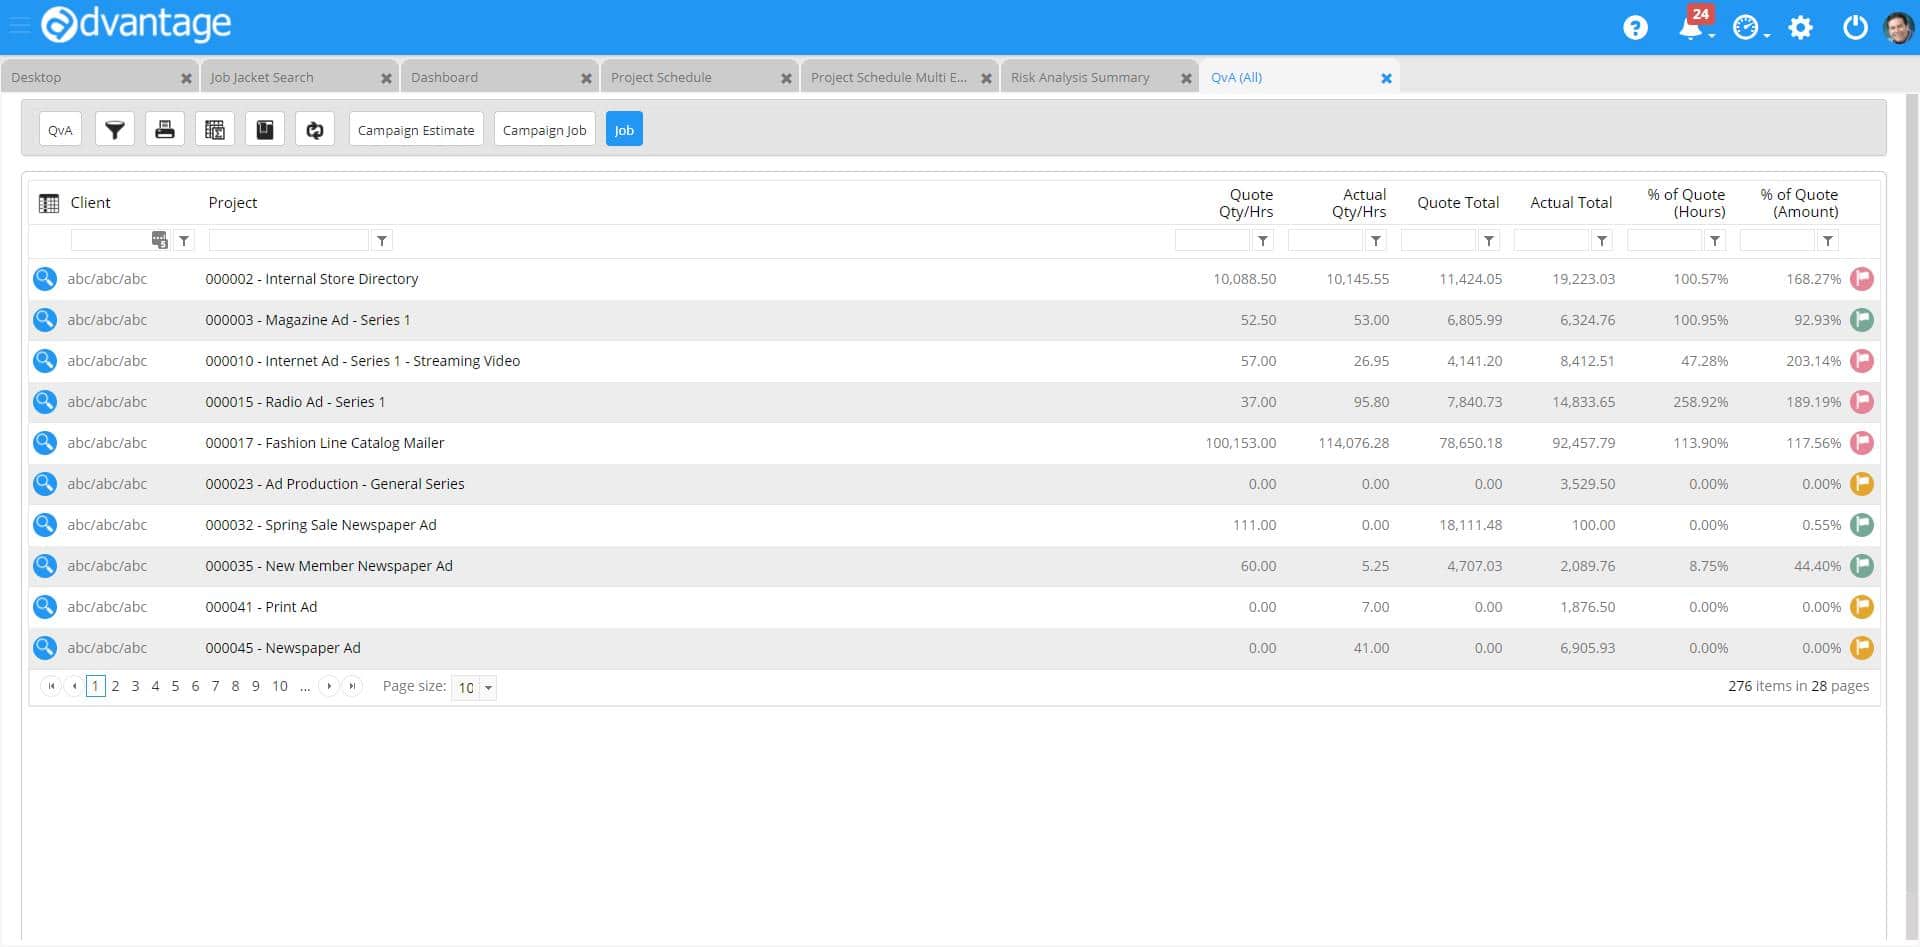
Easily scan the financial status of all active projects. Projects that are close to the client budget are flagged in yellow, and those that have gone over are red. Easily drill into project details from here so you can quickly make the right adjustments to bring things back on track.
Resource Availability Dashboard
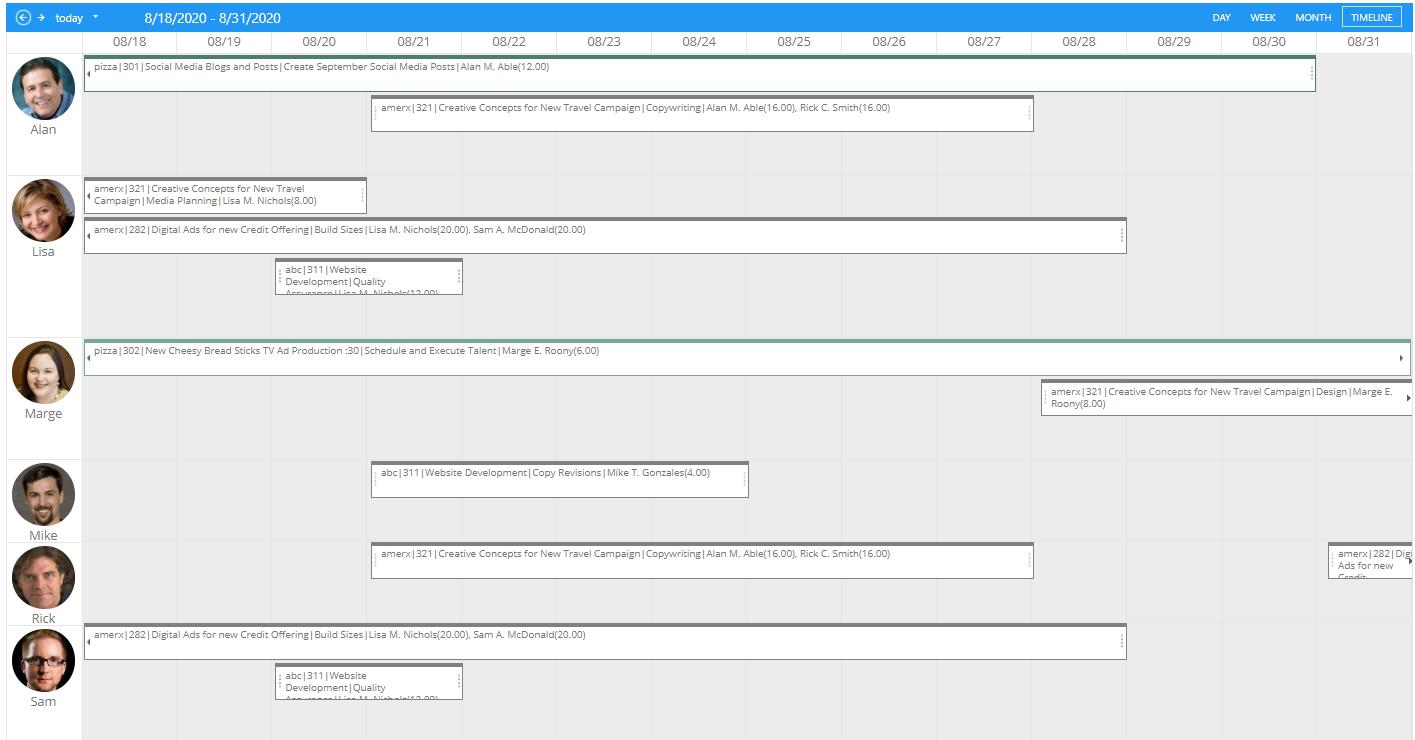
Who is available now, and what are our staffing needs going forward? The availability chart displays department/team or individual availability for up to a year. Determine who is over-booked, under-booked or just right. Drill down to view details by employee and make adjustments on the fly.


